Easiest way for JavaScript Network Graph Visualization – Vis.js
In this blog, we are going to create the JavaScript Network graph visualization in one of the easiest way possible, using vis.js Network.
For our Compiler course here at Kathmandu University, we needed to create an SLR Parser project. And as a part of it we needed to create a Network Graph.
Now, network graph are very interesting form of data visualization. They might be as simple or as complex as it can get. The one from compiler is quite an complex one. Its here.
So, we create simple ones. And we are using vis.js.
What is vis.js – JavaScript Graph Visualization Library
As stated in the homepage of vis.js itself, vis.js is “A dynamic, browser based visualization library. The library is designed to be easy to use, to handle large amounts of dynamic data, and to enable manipulation of and interaction with the data. The library consists of the components DataSet, Timeline, Network, Graph2d and Graph3d.”
Now, there are a ton of JavaScript Graph Visualization libraries out there. Here is a good article with compilation of those. link
As the compiler project itself was complex, we wanted the visualization part to be simple, yet give us what we wanted. And vis.js was what was needed.
Let’s create the Network Graph in JavaScript
Now, lets code for JavaScript network graph visualization.
I use VS Code and its my favorite code editor. Which one is yours?
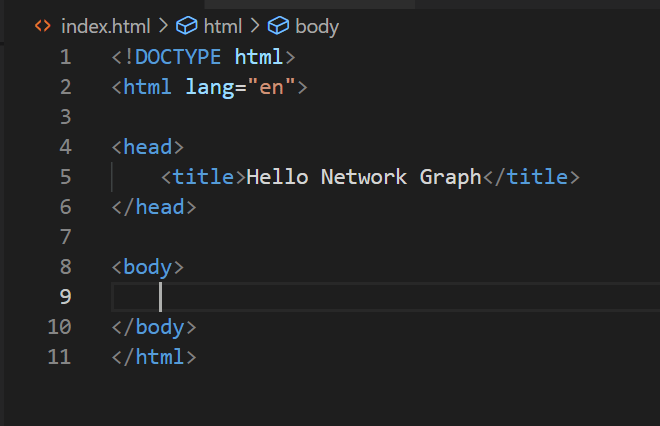
So, lets create a new file index.html. Just a simple basic HTML file.
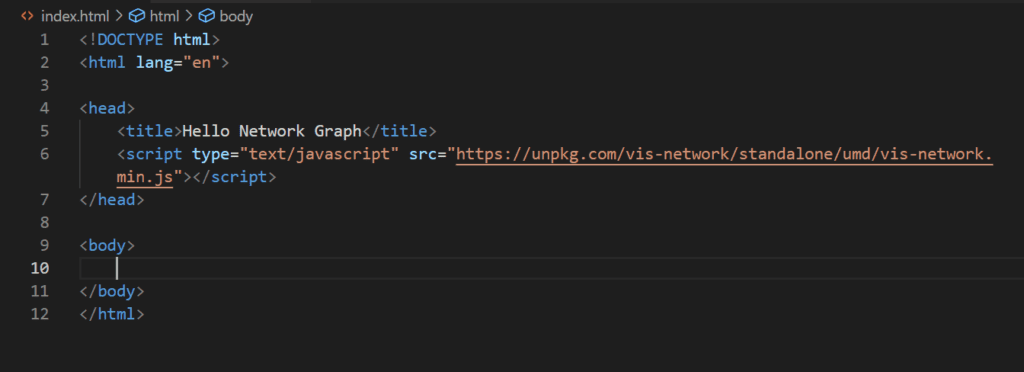
Then, add the vis.js standalone network cdn file from the link. Or simply add a new script tag with source ‘https://unpkg.com/vis-network/standalone/umd/vis-network.min.js’.
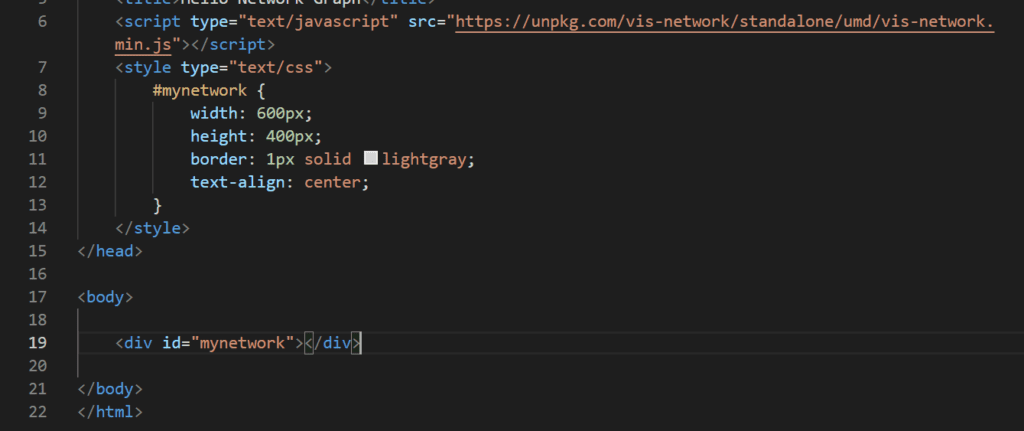
Then add the block to show the network graph. Here, we give it the id of ‘mynetwork’ and add some CSS stylings.
Now, we are done with the setup. Now lets build edges and nodes. Below all is now our JavaScript Code.
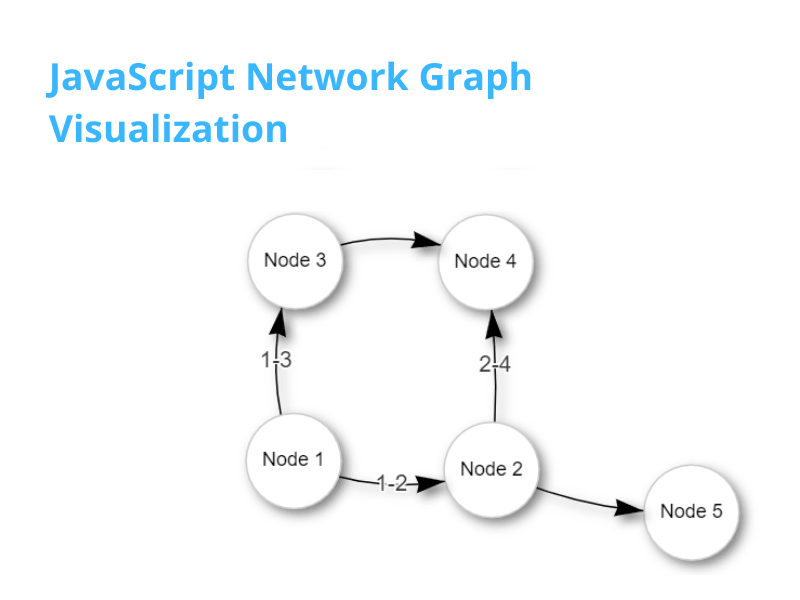
Next, we create an array of nodes and edges.
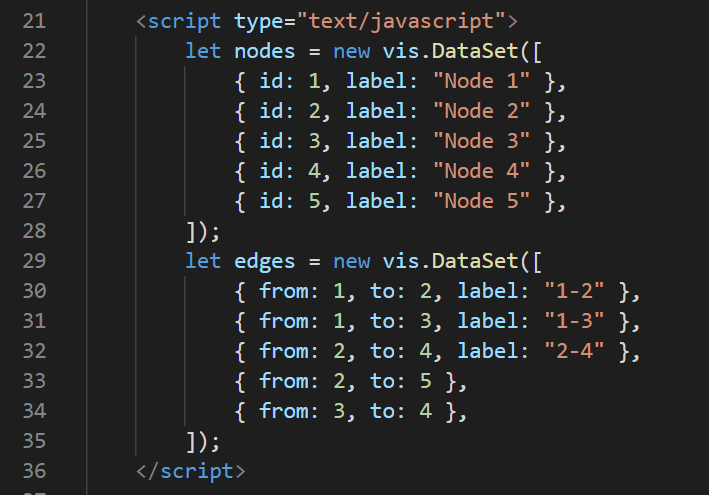
For nodes, in simplest form, we give them an id and a label.
And for edges, a from and to, where we basically give the id of node, from where the edge to start and where to go. Optionally, we can add label as well.
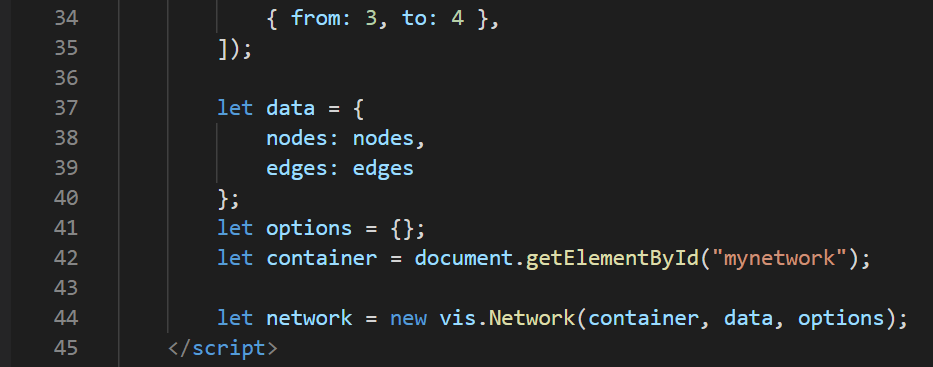
And Finally, we create the network.
So finally, we create the data object with edges and nodes. Options can be left blank for now. And, the container is our div. And, we pass all that to Network function.
The Final Code
Here is the final code.
<!DOCTYPE html>
<html lang="en">
<head>
<title>Hello Network Graph</title>
<script type="text/javascript" src="https://unpkg.com/vis-network/standalone/umd/vis-network.min.js"></script>
<style type="text/css">
#mynetwork {
width: 600px;
height: 400px;
border: 1px solid lightgray;
text-align: center;
}
</style>
</head>
<body>
<div id="mynetwork"></div>
<script type="text/javascript">
let nodes = new vis.DataSet([
{ id: 1, label: "Node 1" },
{ id: 2, label: "Node 2" },
{ id: 3, label: "Node 3" },
{ id: 4, label: "Node 4" },
{ id: 5, label: "Node 5" },
]);
let edges = new vis.DataSet([
{ from: 1, to: 2, label: "1-2" },
{ from: 1, to: 3, label: "1-3" },
{ from: 2, to: 4, label: "2-4" },
{ from: 2, to: 5 },
{ from: 3, to: 4 },
]);
let data = {
nodes: nodes,
edges: edges
};
let options = {};
let container = document.getElementById("mynetwork");
let network = new vis.Network(container, data, options);
</script>
</body>
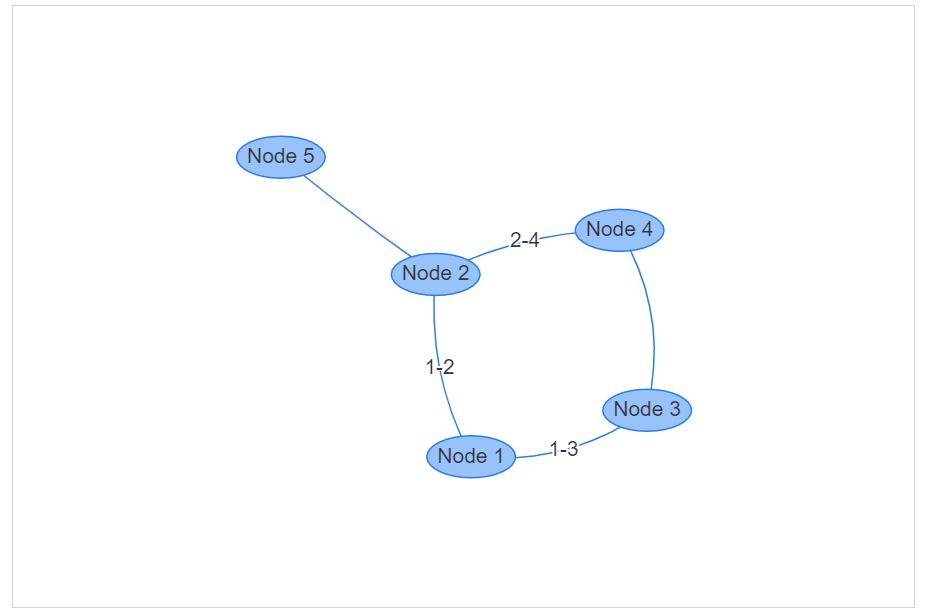
</html>With this code, there would be a simple graph. The best thing is, it is interactive. Try dragging the nodes.
All this is greatly explained in here as well. The documentation is just as a developer would need it, with perfect examples of shorthand options, full options and explanations.
Graph Decoration
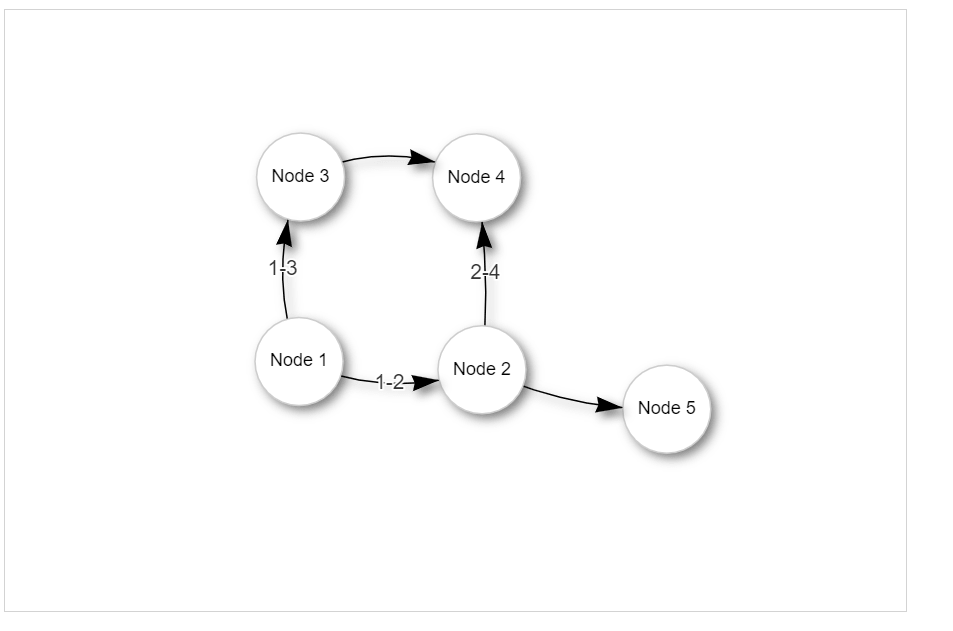
For a bit more decoration, try adding these to the options:
      let options = {
            nodes:{
                color: '#ffffff',
                fixed: false,
                font: '12px arial black',
                scaling: {
                    label: true
                },
                shadow: true,
                shape: 'circle',
                margin: 10
            },
            edges: {
                arrows: 'to',
                color: 'black',
                scaling: {
                    label: true,
                },
                shadow: true,
            }
        };
This will be the result.
This is how we can create the JavaScript Network graph visualization using vis.js network.
Also have a look at Flight Agenda Problem using Dijkstra’s Algorithm

![[Working] How to install WordPress on Ubuntu 20.04 Linux | Azure VM](https://awan.com.np/wp-content/uploads/2021/07/Install-WordPress-on-Ubuntu-768x576.jpg)

![[SOLVED] How to Disable Edge Alt + Tab Settings in Windows 10](https://awan.com.np/wp-content/uploads/2021/07/How-to-Remove-Edge-Browser-Tabs-From-AltTab-on-Windows-10-1-768x430.png)